If you drop by here regularly, you may have noticed: the last article dates from 30 October. That was part 14 on the Comet X, and since then, nothing. The homelab hasn’t gone up in flames, the rack is still standing and I haven’t given up on the blog. My head was just in another project, which ended up taking over everything.
How much time exactly? Honestly, I didn’t count. I worked on it in the evenings and at weekends, at my own pace and with no pressure.
It’s called Tapyr, it’s my second open source project after Keymaker. Let me introduce it.
The problem: APIs that count your calls#
More and more network equipment is managed from the cloud: Wi-Fi access points, switches, SD-WAN gateways, 4G and 5G routers. The vendor provides a management console and often a REST API. To collect and centralise metrics, it’s tempting: you poll the API regularly, push everything into Prometheus and admire the result in Grafana.
Except these APIs ration your calls and rarely in just one way. A few examples, taken from the vendors’ documentation:
- Aruba Central (classic platform): 7 calls per second and a quota of at least 5,000 calls per day, reset at midnight GMT
- Cisco Meraki: 10 requests per second per organisation, shared with every other application using the API
- Teltonika RMS: 100,000 requests per month
Picture a naive collector that polls everything, every minute. In the morning (or at the start of the month), all is well. By midday (or mid-month), the quota is used up, the API answers 429 Too Many Requests to every call and all your devices vanish from the graphs until the reset. The cause is hiding in a response header nobody looks at. And on a dashboard, a missing device gets treated as a broken one.
On top of that, every vendor has its own API, its own pagination and its own authentication: you need a different exporter per vendor, each with its own way of handling (or ignoring) the limits.
It’s against this backdrop that Tapyr was born.
What Tapyr does#
In one sentence: Tapyr turns the APIs of cloud-managed network equipment into clean metrics, without ever exhausting their quotas.
It’s a gateway written in Go, under the Apache 2.0 licence, that you host yourself. It polls the APIs, normalises the data (same label and unit conventions for every vendor) and delivers it as Prometheus or OTLP, to the backend of your choice.
Its core idea: treat the quota as a budget you plan, not as a wall you discover by crashing into it head-on. Every call is scheduled according to all of the vendor’s limits: rates, daily or monthly quotas, per account or per organisation, concurrent calls. When the budget gets tight, the lowest priority jobs slow down first and the critical jobs keep their pace. A reserve is even kept aside for retries.
Around this core:
- An API is described, not coded. Endpoints, authentication, pagination and turning JSON into metrics are all written in YAML and CEL (Google’s expression language, used by Kubernetes among others). Adding a vendor doesn’t take a single line of Go.
- A simulator per provider, which applies the vendor’s real limits, failure scenarios included. You can try everything without an account.
- Monitoring the monitoring: Tapyr exports its own metrics, including the remaining quota and when it’s expected to run out.
- A read-only web interface, built into the binary, to see what’s running.
How it works#
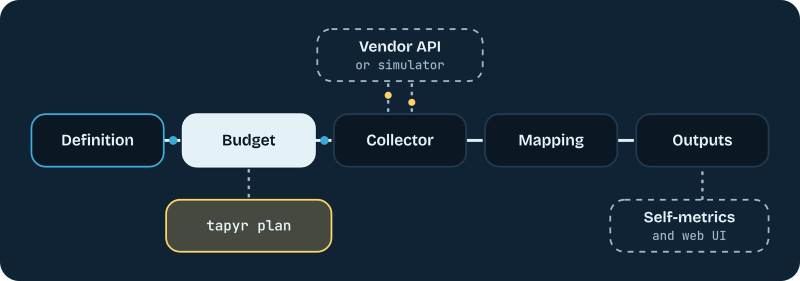
- You describe the API once: its endpoints, its pagination, how its JSON becomes metrics, and every limit imposed by the vendor.
- The budget engine schedules every call, and works out for each job an interval that fits within the quotas. It also reads the API’s quota headers, to account for other applications drawing from the same budget.
- The collector fetches the data, follows the pagination, retries what fails and respects
Retry-Afterwhen the vendor asks it to slow down. - The mapping turns JSON into metrics, with CEL expressions that pick the items, compute the values and set the labels.
- The outputs deliver: Prometheus exposition and remote write, OTLP over HTTP and gRPC.
And before the very first call, tapyr plan shows what a configuration will consume on each quota and which jobs will be slowed down so that everything fits.
What about the homelab?#
Readers of the My homelab from scratch series will recognise a few names. My network runs on UniFi (part 2 and part 3) and my 5G backup is a Teltonika (part 4): two families Tapyr knows how to poll.
Tapyr actually runs internally on the homelab: it’s my pre-production, where I validate the project against my own APIs. And if you want to see what it looks like without installing anything, a public instance runs as a demo too, with the Tapyr interface and its Grafana, on simulated APIs.
On the observability side, I’d sketched out a single Grafana for the whole lab in part 5 and part 13 pushed Prometheus and Grafana back to later. They’re still on the agenda.
Where the project stands#
As of today, Tapyr is at version 0.4.0, released on 14 November 2026. Let’s be clear: this is a 0.x project. The configuration format may still change from one minor version to the next, and every change is recorded in the changelog.
Seven providers are built in, each with a displayed validation status:
| Provider | What it covers | Validation |
|---|---|---|
| Aruba Central (classic) | access points, switches, gateways | real platform |
| Cisco Meraki | Dashboard API v1 | real platform |
| Teltonika RMS | cloud management of the routers | real platform |
| Teltonika RutOS | the routers’ local API | real platform |
| UniFi Site Manager | consoles, sites, devices, ISP metrics | real platform |
| Cisco ThousandEyes | network tests and agents | simulator only |
| Juniper Mist | access points, switches, WAN edge | simulator only |
ThousandEyes and Mist are still waiting for a real account to be validated. If you have one, your feedback is precious.
For installation, everything is available: a Docker image, a Helm chart, deb and rpm packages, Homebrew on macOS, and the binaries for Linux, macOS and Windows.
Try it without any account#
The easiest way is the public demo mentioned above: the Tapyr interface and its Grafana, on simulated APIs, read-only.
If you’d rather run it at home, the same demo runs in Docker Compose, with the simulators, VictoriaMetrics and Grafana:
git clone https://github.com/kentrow/tapyr.git
cd tapyr/examples/compose
docker compose up -d
Grafana answers on http://127.0.0.1:3000, the Tapyr interface on http://127.0.0.1:9790/ui/ and the first metrics show up in under a minute. Everything else is in the documentation.
What it taught me#
With Keymaker, I wrote that releasing a project isn’t just pushing code to GitHub. Tapyr pushes that further. Keymaker is a workshop tool, which runs for the length of a session. Tapyr, on the other hand, is built to run continuously, on other people’s setups, with their credentials. So it needs versioned documentation, signed releases, a simulator so nobody needs accounts with seven vendors and genuine honesty about what has been validated, and against what.
What’s next#
For Tapyr, the question is simple: which API should be next? Networking is the first use case, not the limit: the engine knows nothing about networks, and any API that serves metrics can be described the same way. The provider ideas page lists some leads, from networking to energy by way of the home. If there’s an API you’re missing, the proposal form in the GitHub issues is there for exactly that.
For the blog, the homelab series is back on: part 15, on the 3D-printed 10-inch rack, is already well under way.
Useful links#
- The Tapyr website
- The documentation
- The public demo
- The GitHub repository and its issues: feedback, ideas and bugs are all welcome
My final word#
If you monitor cloud-managed equipment and you’ve ever watched a dashboard empty itself for no obvious reason, take a look at the project and feel free to give it a spin. And if you like Tapyr, a star on the repository is always appreciated.
See you soon!